Improving assessment

With Diagnostic Classification Models

W. Jake Thompson, Ph.D.

Welcome!

Who am I?


W. Jake Thompson, Ph.D.

  • Assistant Director of Psychometrics
    • ATLAS | University of Kansas
  • Research: Applications of diagnostic psychometric models

Materials

All materials are available on the workshop website:

https://learn.r-dcm.org

Installation

  • Required
    • R (≥ 4.5.0)
    • rstan (≥ 2.32.7)
    • measr (≥ 2.0.1)
  • Recommended
    • RStudio (≥ 2026.01.1-403)
    • cmdstanr (≥ 0.9.0)
    • CmdStan (≥ 2.38.0)

Copy and run

install.packages(c("measr", "tidyverse", "here", "fs", "usethis"))

# Optional
install.packages(
  c("rstan", "StanHeaders", "cmdstanr"),
  repos = c("https://stan-dev.r-universe.dev", getOption("repos"))
)

## check toolchain
cmdstanr::check_cmdstan_toolchain()
cmdstanr::install_cmdstan(cores = 2)

For help installing RStan, CmdStanR, or configuring the toolchain, see the prework page (https://learn.r-dcm.org/materials/prework).

Diagnostic assessments

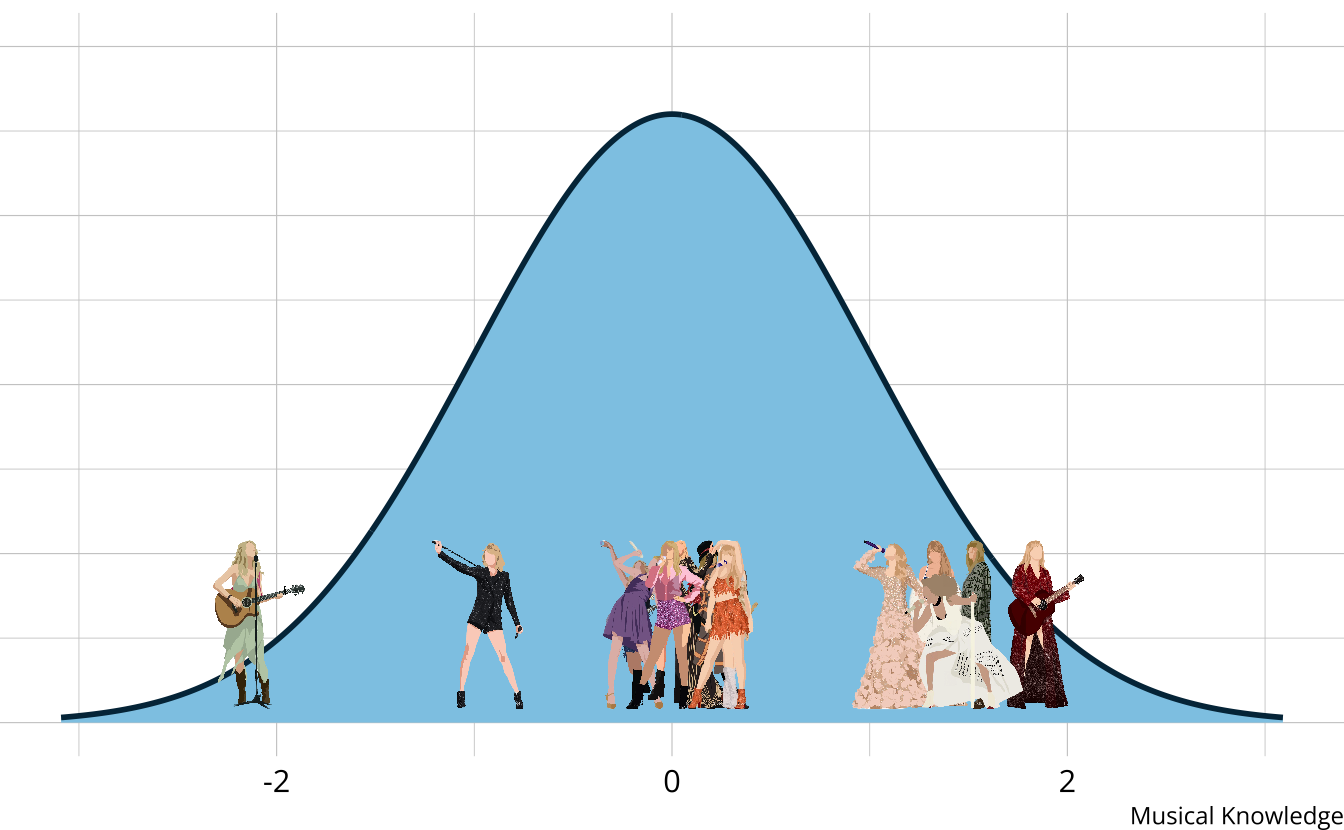
  • Traditional assessments and psychometric models measure an overall skill or ability
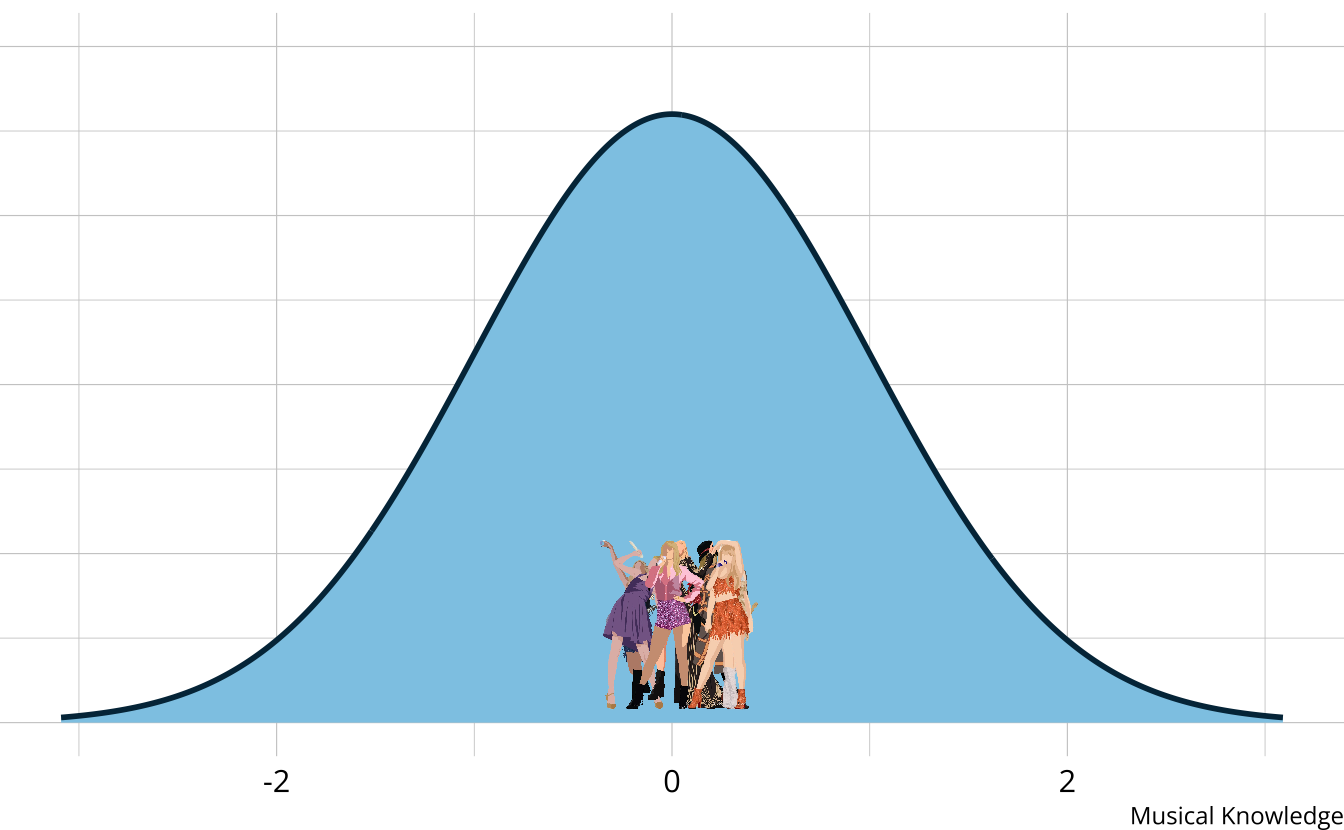
  • Assume a continuous latent trait

A normal distribution with images of Taylor Swift from each era overlayed.

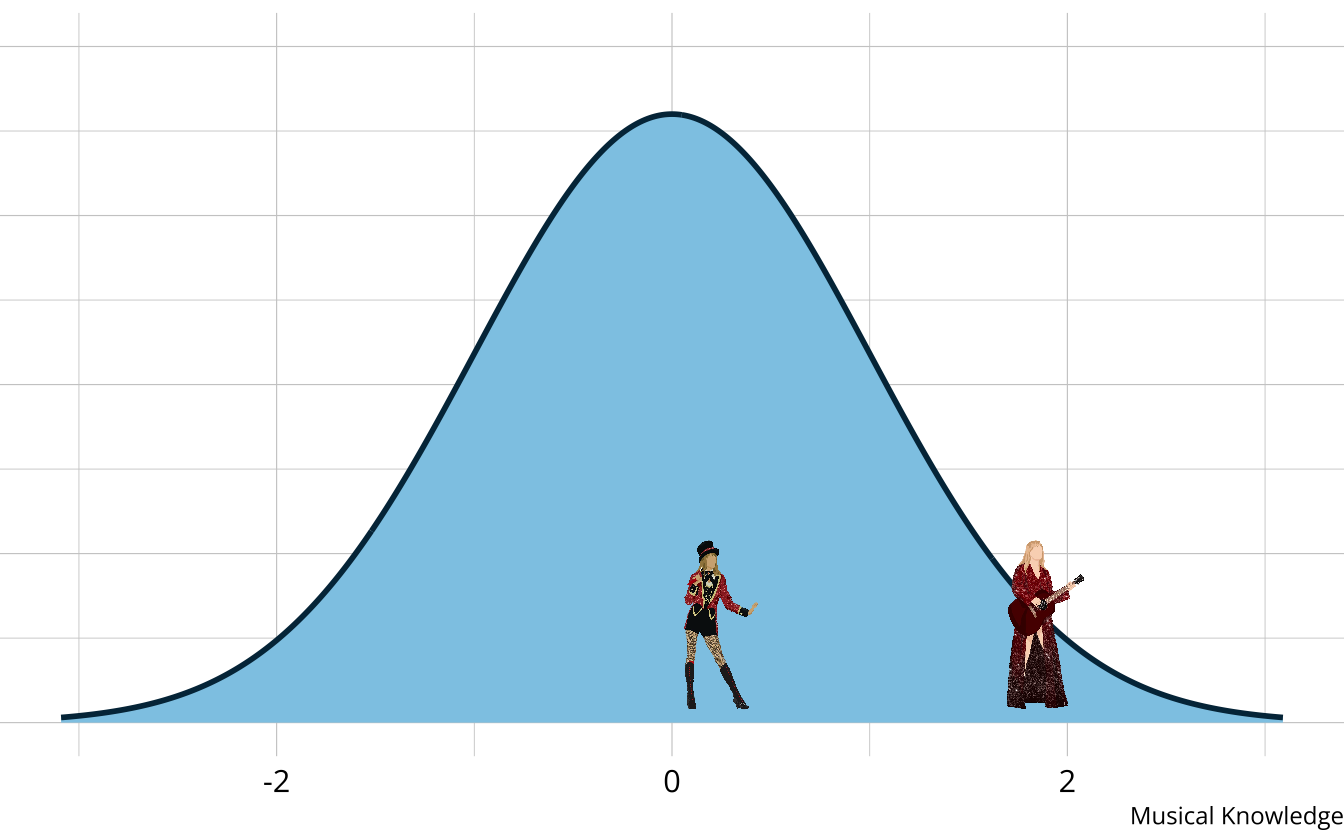
  • The output is a weak ordering due to error in estimates
    • Confident Taylor Swift (debut) is the worst
    • Not confident on ordering toward the middle of the distribution

A normal distribution with images of Taylor Swift from each era overlayed.

  • Limited in the types of questions that can be answered.
    • Why is Taylor Swift (debut) so low?
    • What aspects do each era demonstrate proficiency or competency of?
    • How much skill is “enough” to be competent?

A normal distribution with images of Taylor Swift from each era overlayed.

Diagnostic measurement

  • Designed to be multidimensional
  • No continuum of student achievement
  • Categorical constructs
    • Usually binary (e.g., master/nonmaster, proficient/not proficient)
  • Several different names in the literature
    • Diagnostic classification models (DCMs)
    • Cognitive diagnostic models (CDMs)
    • Skills assessment models
    • Latent response models
    • Restricted latent class models

Diagnostic music assessment

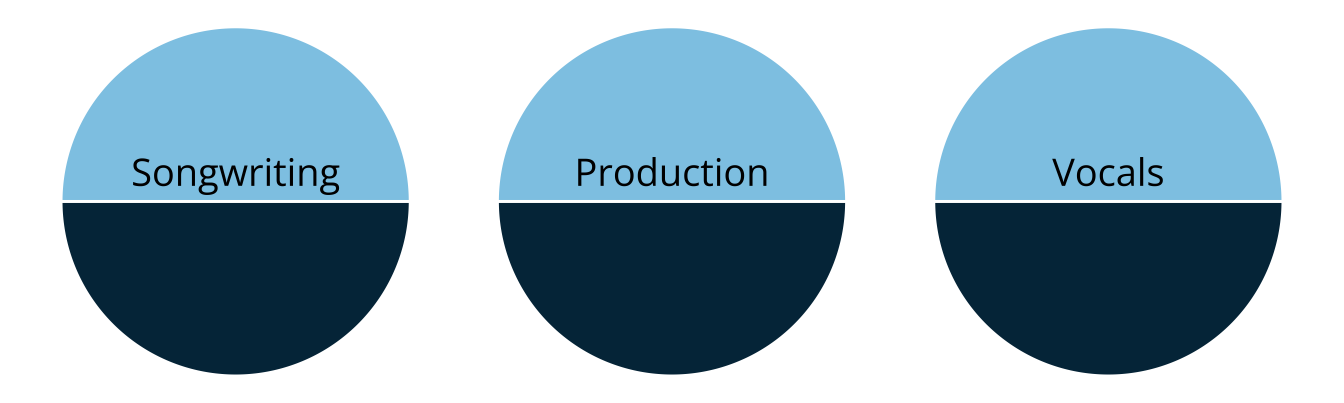
  • Rather than measuring overall musical knowledge, we can break music down into set of skills or attributes
    • Songwriting
    • Production
    • Vocals

Three circles representing the 3 attributes. The bottom half of each circle is shaded dark, and the top half is light, to indicate there are two categories for each attribute.

  • Attributes are categorical, often dichotomous (e.g., proficient vs. non-proficient)

Diagnostic classification models

  • DCMs place individuals into groups according to proficiency of multiple attributes
  • Students are probabilistically placed into classes
    • Classes are represented by skill profiles
  • Feedback on specific skills as defined by the cognitive theory and test design
  • No scale, no overall “ability”
songwriting production vocals
Xmark Xmark Xmark
Xmark Check Check
Check Xmark Check
Check Check Check

Benefits of DCMs

  • Fine-grained, multidimensional results. Answer more questions:
    • Why is Taylor Swift (debut) so low?
      • Subpar songwriting, production, and vocals
    • What aspects are albums competent/proficient in?
      • DCMs provide classifications directly
  • High reliability with fewer items
    • Less information need to classify than to place precisely along a scale
songwriting production vocals
Xmark Xmark Xmark
Xmark Check Check
Check Xmark Check
Check Check Check

Fine-grained feedback

  • Distinguish between respondents who may have similar scale scores
songwriting production vocals
Check Xmark Xmark
Check Xmark Xmark
Check Check Check
Check Xmark Check
Xmark Xmark Check
Check Check Check
Check Xmark Xmark
Xmark Check Check

When are DCMs appropriate?

Success depends on:

  1. Domain definitions
    • What are the attributes we’re trying to measure?
    • Are the attributes measurable (e.g., with assessment items)?
  2. Alignment of purpose between assessment and model
    • Is classification the purpose?

Example applications

  • Educational measurement: The competencies that student is or is not proficient in
    • Latent knowledge, skills, or understandings
    • Used for tailored instruction and remediation
  • Psychiatric assessment: The DSM criteria that an individual meets
    • Broader diagnosis of a disorder

When are DCMs not appropriate?

  • When the goal is to place individuals on a scale

  • DCMs do not distinguish within classes


songwriting production vocals
Check Check Check
Check Check Check

Using diagnostic models

Hex logo for the measr R package.

What is measr?

  • R package that automates the creation of Stan scripts for DCMs
  • Wraps rstan or cmdstanr to estimate the models
  • Provides additional functions to automate the evaluation of DCMs
    • Model fit
    • Classification accuracy and consistency

Data for examples

  • Examination for the certificate of proficiency in English (ECPE; Templin & Hoffman, 2013)
    • 28 items measuring 3 total attributes
    • 2,922 respondents
  • 3 attributes
    • Morphosyntactic rules
    • Cohesive rules
    • Lexical rules

ECPE data

library(dcmdata)

ecpe_data
#> # A tibble: 2,922 × 29
#>    resp_id    E1    E2    E3    E4    E5    E6    E7    E8    E9   E10   E11
#>      <int> <int> <int> <int> <int> <int> <int> <int> <int> <int> <int> <int>
#>  1       1     1     1     1     0     1     1     1     1     1     1     1
#>  2       2     1     1     1     1     1     1     1     1     1     1     1
#>  3       3     1     1     1     1     1     1     0     1     1     1     1
#>  4       4     1     1     1     1     1     1     1     1     1     1     1
#>  5       5     1     1     1     1     1     1     1     1     1     1     1
#>  6       6     1     1     1     1     1     1     1     1     1     1     1
#>  7       7     1     1     1     1     1     1     1     1     1     1     1
#>  8       8     0     1     1     1     1     1     0     1     1     1     0
#>  9       9     1     1     1     1     1     1     1     1     1     1     1
#> 10      10     1     1     1     1     0     0     1     1     1     1     1
#> # ℹ 2,912 more rows
#> # ℹ 17 more variables: E12 <int>, E13 <int>, E14 <int>, E15 <int>, E16 <int>,
#> #   E17 <int>, E18 <int>, E19 <int>, E20 <int>, E21 <int>, E22 <int>,
#> #   E23 <int>, E24 <int>, E25 <int>, E26 <int>, E27 <int>, E28 <int>

ECPE Q-matrix

ecpe_qmatrix
#> # A tibble: 28 × 4
#>    item_id morphosyntactic cohesive lexical
#>    <chr>             <int>    <int>   <int>
#>  1 E1                    1        1       0
#>  2 E2                    0        1       0
#>  3 E3                    1        0       1
#>  4 E4                    0        0       1
#>  5 E5                    0        0       1
#>  6 E6                    0        0       1
#>  7 E7                    1        0       1
#>  8 E8                    0        1       0
#>  9 E9                    0        0       1
#> 10 E10                   1        0       0
#> # ℹ 18 more rows

Data for exercises

Exercise 1

  1. Download the exercise files
usethis::use_course("r-dcm/pce2026-exercises")
  1. Open exercises.Rmd

  2. Run the setup chunk

  3. Explore the ROAR-PA data and Q-matrix

    • How many items are in the data?
    • How many respondents are in the data?
    • How many attributes are measured?

roarpa_data
#> # A tibble: 222 × 58
#>       id fsm_01 fsm_04 fsm_05 fsm_06 fsm_07 fsm_08 fsm_10 fsm_11 fsm_12 fsm_14
#>    <int>  <int>  <int>  <int>  <int>  <int>  <int>  <int>  <int>  <int>  <int>
#>  1   161      0      1      1      1      1      0      0      1      1      1
#>  2   226      0      1      0      1      0      0      1      0      1      0
#>  3   103      0      1      0      1      0      0      0      0      0      0
#>  4     7      1      1      0      0      1      0      0      0      1      1
#>  5   185      1      1      1      1      1      1      1      1      1      1
#>  6    36      1      1      1      1      1      1      1      1      1      1
#>  7   206      1      1      1      1      1      1      1      1      1      1
#>  8   115      1      1      1      1      1      1      1      1      1      1
#>  9   106      1      1      1      1      1      1      1      1      1      1
#> 10   205      1      1      1      1      0      0      1      1      1      1
#> # ℹ 212 more rows
#> # ℹ 47 more variables: fsm_15 <int>, fsm_16 <int>, fsm_17 <int>, fsm_18 <int>,
#> #   fsm_21 <int>, fsm_22 <int>, fsm_23 <int>, fsm_24 <int>, fsm_25 <int>,
#> #   lsm_01 <int>, lsm_02 <int>, lsm_04 <int>, lsm_05 <int>, lsm_06 <int>,
#> #   lsm_07 <int>, lsm_08 <int>, lsm_10 <int>, lsm_11 <int>, lsm_13 <int>,
#> #   lsm_15 <int>, lsm_16 <int>, lsm_17 <int>, lsm_18 <int>, lsm_19 <int>,
#> #   lsm_20 <int>, lsm_21 <int>, lsm_22 <int>, lsm_24 <int>, del_01 <int>, …
  • 57 items
  • 222 respondents
roarpa_qmatrix
#> # A tibble: 57 × 4
#>    item     lsm   del   fsm
#>    <chr>  <int> <int> <int>
#>  1 fsm_01     0     0     1
#>  2 fsm_04     0     0     1
#>  3 fsm_05     0     0     1
#>  4 fsm_06     0     0     1
#>  5 fsm_07     0     0     1
#>  6 fsm_08     0     0     1
#>  7 fsm_10     0     0     1
#>  8 fsm_11     0     0     1
#>  9 fsm_12     0     0     1
#> 10 fsm_14     0     0     1
#> # ℹ 47 more rows
  • 57 items
  • 3 attributes
    • First sound matching (fsm)
    • Last sound matching (lsm)
    • Deletion (del)

Model specification

Specify a DCM with dcm_specify()

ecpe_spec <- dcm_specify(
  qmatrix = ecpe_qmatrix,
  identifier = "item_id",
  measurement_model = lcdm(),
  structural_model = unconstrained()
)
1
Specify your Q-matrix, and ID column (if present)
2
Choose the measurement and structural model to estimate

Exercise 2

  • Create a model specification for the ROAR-PA data

  • Use lcdm() for the measurement model and unconstrained() for the structural model

roarpa_spec <- dcm_specify(
  qmatrix = roarpa_qmatrix,
  identifier = "item",
  measurement_model = lcdm(),
  structural_model = unconstrained()
)

Model estimation

Estimate a DCM with dcm_estimate()

ecpe_lcdm <- dcm_estimate(
  dcm_spec = ecpe_spec,
  data = ecpe_data,
  identifier = "resp_id",
  method = "pathfinder",
  backend = "cmdstanr",
  single_path_draws = 1000,
  num_paths = 10,
  draws = 2000,
  file = here("materials", "slides", "fits", "ecpe-lcdm-uncst")
)
1
Define your model specification
2
Specify your data and ID column (if present)
3
Choose your estimation method and backend
4
Pass additional arguments to the backend
5
Save the model for future efficiency

dcm_estimate() options

  • method: How to estimate the model
    • Full posterior sampling with “mcmc”
    • Quicker, but more limited “optim”
    • Posterior approximation with “variational” (default) or “pathfinder”
      • Variational inference does not always converge
      • Pathfinder is only available for the cmdstanr backend
  • ...: Additional arguments that are passed to, depending on the method and backend

Exercise 3

  • Estimate an LCDM on the ROAR-PA data using variational inference.
    • Use rstan for the backend
    • Use seed: 19891213

roarpa_lcdm <- dcm_estimate(
  roarpa_spec,
  data = roarpa_data,
  identifier = "id",
  method = "variational",
  backend = "rstan",
  seed = 19891213,
  file = here("materials", "slides", "fits", "roarpa-lcdm-uncst")
)

Extracting structural parameters

measr_extract(ecpe_lcdm, "strc_param")
#> # A tibble: 8 × 5
#>   class   morphosyntactic cohesive lexical         estimate
#>   <chr>             <int>    <int>   <int>       <rvar[1d]>
#> 1 [0,0,0]               0        0       0  0.291 ± 0.00588
#> 2 [1,0,0]               1        0       0  0.018 ± 0.00198
#> 3 [0,1,0]               0        1       0  0.020 ± 0.00117
#> 4 [0,0,1]               0        0       1  0.133 ± 0.00517
#> 5 [1,1,0]               1        1       0  0.015 ± 0.00253
#> 6 [1,0,1]               1        0       1  0.020 ± 0.00097
#> 7 [0,1,1]               0        1       1  0.154 ± 0.00909
#> 8 [1,1,1]               1        1       1  0.350 ± 0.00487

Extracting respondent probabilities

measr_extract(ecpe_lcdm, "attribute_prob")
#> # A tibble: 2,922 × 4
#>    resp_id morphosyntactic cohesive lexical
#>    <chr>             <dbl>    <dbl>   <dbl>
#>  1 1               0.997     0.951   1.000 
#>  2 2               0.995     0.866   1.000 
#>  3 3               0.976     0.987   1.000 
#>  4 4               0.998     0.990   1.000 
#>  5 5               0.990     0.979   0.944 
#>  6 6               0.993     0.989   1.000 
#>  7 7               0.993     0.989   1.000 
#>  8 8               0.00208   0.403   0.973 
#>  9 9               0.953     0.984   0.998 
#> 10 10              0.701     0.0932  0.0847
#> # ℹ 2,912 more rows

Exercise 4

  • What proportion of respondents have mastered both first and last sound matching in the ROAR-PA data?

  • What is the probability that respondent 153 has mastered deletion?

measr_extract(roarpa_lcdm, "strc_param")
#> # A tibble: 8 × 5
#>   class     lsm   del   fsm        estimate
#>   <chr>   <int> <int> <int>      <rvar[1d]>
#> 1 [0,0,0]     0     0     0  0.158 ± 0.0269
#> 2 [1,0,0]     1     0     0  0.011 ± 0.0083
#> 3 [0,1,0]     0     1     0  0.047 ± 0.0169
#> 4 [0,0,1]     0     0     1  0.059 ± 0.0198
#> 5 [1,1,0]     1     1     0  0.037 ± 0.0151
#> 6 [1,0,1]     1     0     1  0.042 ± 0.0162
#> 7 [0,1,1]     0     1     1  0.099 ± 0.0228
#> 8 [1,1,1]     1     1     1  0.546 ± 0.0400

measr_extract(roarpa_lcdm, "strc_param") |>
  filter(fsm == 1, lsm == 1) |>
  summarize(estimate = rvar_sum(estimate))
#> # A tibble: 1 × 1
#>        estimate
#>      <rvar[1d]>
#> 1  0.59 ± 0.039
measr_extract(roarpa_lcdm, "attribute_prob") |>
  filter(id == 153)
#> # A tibble: 1 × 4
#>   id         lsm   del   fsm
#>   <chr>    <dbl> <dbl> <dbl>
#> 1 153   5.21e-11 0.464 1.000

What’s next?

Learn more about DCMs

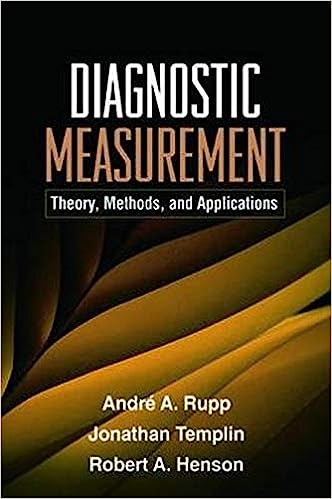
Cover of Diagnostic Measurement book by Rupp, Templin, and Henson.

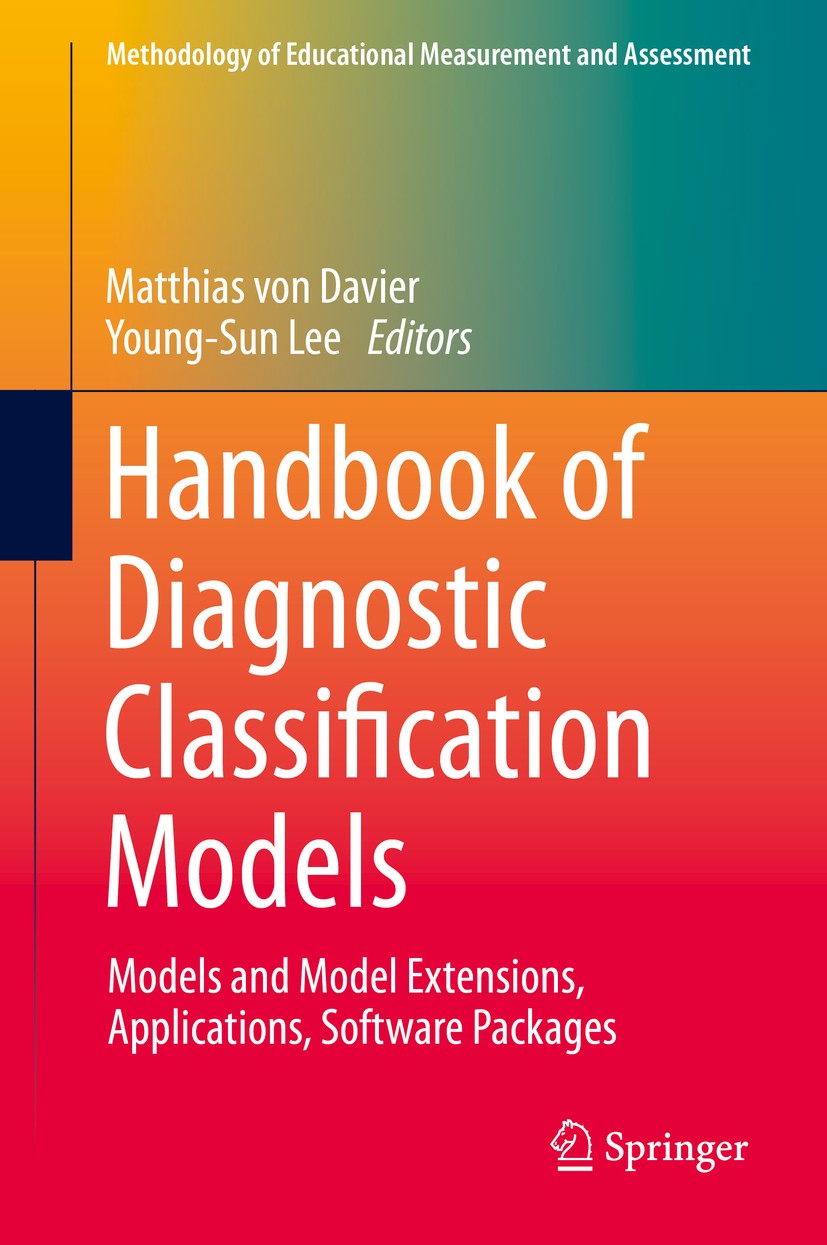
Cover of the Handbook of Diagnostic Classification Models by von Davier and Lee.

Learn more about measr

Feedback

We value your feedback! To answer a short survey about and provide feedback on the {measr} package, please follow this link to a Qualtrics survey.

ATLAS at the University of Kansas is conducting research to better understand the software development process for {measr}. Individuals who have used the {measr} package and are at least 18 years of age are invited to complete a 5-minute survey on their experiences. For questions, please contact Jake Thompson at wjakethompson@ku.edu.
QR code to take the workshop survey.

https://learn.r-dcm.org

Acknowledgements

The research reported here was supported by the Institute of Education Sciences, U.S. Department of Education, through Grants R305D210045 and R305D240032 to the University of Kansas Center for Research, Inc., ATLAS. The opinions expressed are those of the authors and do not represent the views of the the Institute or the U.S. Department of Education.

Logo for the Institute of Education Sciences.