measr_extract(ecpe_lcdm, "strc_param")
#> # A tibble: 8 × 5
#>   class   morphosyntactic cohesive lexical         estimate
#>   <chr>             <int>    <int>   <int>       <rvar[1d]>
#> 1 [0,0,0]               0        0       0  0.291 ± 0.00588
#> 2 [1,0,0]               1        0       0  0.018 ± 0.00198
#> 3 [0,1,0]               0        1       0  0.020 ± 0.00117
#> 4 [0,0,1]               0        0       1  0.133 ± 0.00517
#> 5 [1,1,0]               1        1       0  0.015 ± 0.00253
#> 6 [1,0,1]               1        0       1  0.020 ± 0.00097
#> 7 [0,1,1]               0        1       1  0.154 ± 0.00909
#> 8 [1,1,1] 1 1 1 0.350 ± 0.00487Identifying model
misspecifications
W. Jake Thompson, Ph.D.
Types of misspecifications
- Attributes
- How many, and which ones?
- Items
- Alignment to attributes
- Measurement model
Attribute misspecifications
Attribute identification
Have we identified the correct number of attributes?
-
Ideally, this is a content-driven process from the beginning
- Identify the skills or constructs we want to measure
- Develop items specifically for those skills using principles of evidence centered design
But often we’re handed data, or are attempting to retrofit a DCM to a previously developed assessment
Too many attributes
- What might some indicators be that we have included too many attributes in our model?
- Some we’ll examine today:
- Structural parameters: Are there classes that aren’t observed and aren’t explained by a hierarchy?
- Attribute correlations: If attributes are very highly correlated, are they really measuring distinct skills?
Structural parameters
- We see respondents in all of the expected classes
Attribute correlations
- We expect to see somewhat high correlations (but not perfect) due to the attribute dependencies
Exercise 1
Open
misspecifications.Rmdand run thesetupchunk.Examine the base rates and attribute correlations for the PIE HDCM model.
What do the findings indicate?
- Very few students are proficient on only Level 1 skills
Too few attributes
- What might some indicators be that we have included too few attributes in our model?
- Some we’ll examine today:
- Local independence: Item responses should be independent conditional on the respondent’s profile of proficiency
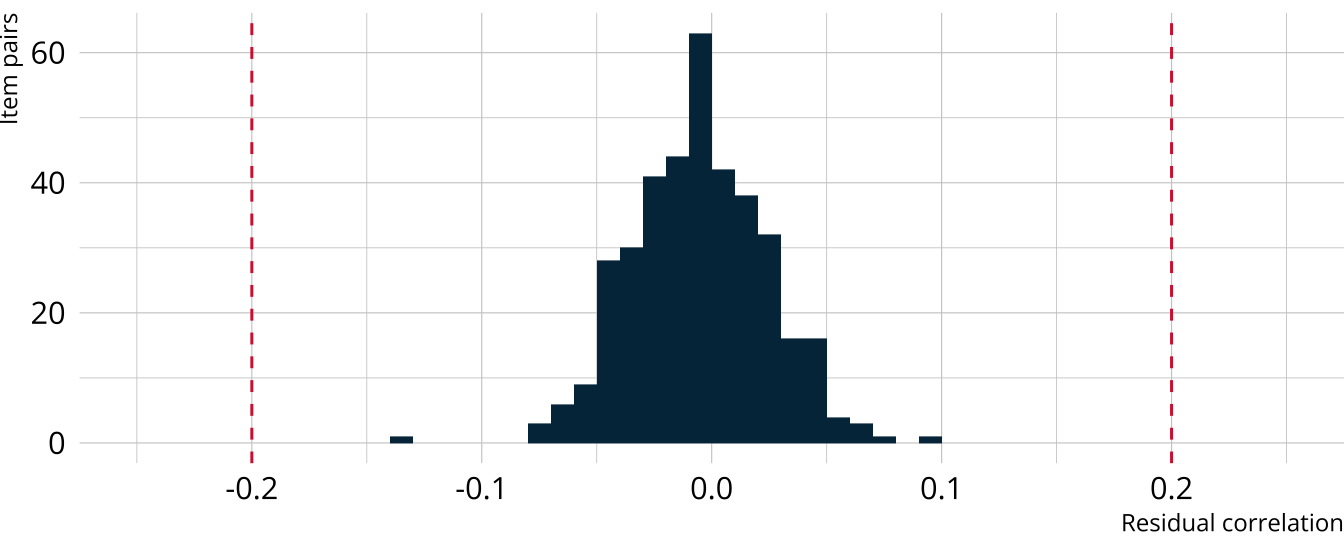
Residual correlations with Yen’s Q3
- Residual correlations should all be relatively small (e.g., <.2)
yens_q3(ecpe_lcdm)
#> # A tibble: 378 × 4
#>    item_1 item_2 resid_corr flag
#>    <chr>  <chr>       <dbl> <lgl>
#>  1 E1     E2       0.00496  FALSE
#>  2 E1     E3      -0.0332   FALSE
#>  3 E1     E4       0.0125   FALSE
#>  4 E1     E5       0.0213   FALSE
#>  5 E1     E6       0.0181   FALSE
#>  6 E1     E7       0.000101 FALSE
#>  7 E1     E8      -0.0240   FALSE
#>  8 E1     E9      -0.0341   FALSE
#>  9 E1     E10     -0.00660  FALSE
#> 10 E1     E11     -0.0262   FALSE
#> # ℹ 368 more rows
Visualizing Yen’s Q3
Exercise 2
Calculate Yen’s Q3 (residual correlations) for the PIE HDCM
What do the findings indicate?
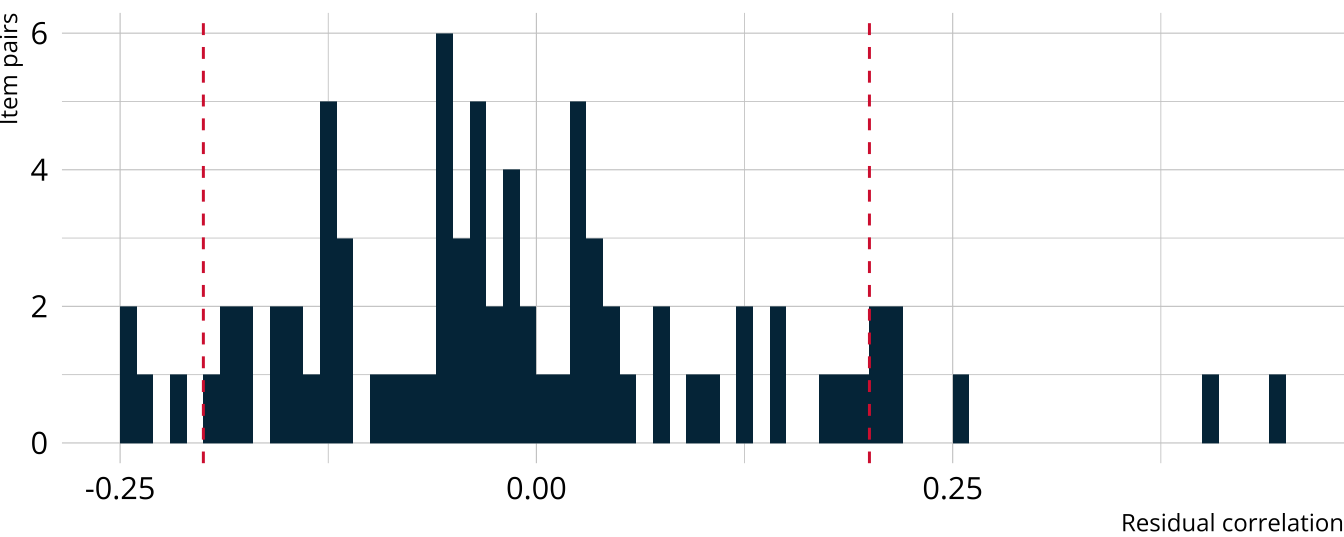
yens_q3(pie_hdcm) |>
  filter(flag)
#> # A tibble: 11 × 4
#>    item_1 item_2 resid_corr flag
#>    <chr>  <chr>       <dbl> <lgl>
#>  1 00592  14415       0.209 TRUE
#>  2 00592  06238       0.402 TRUE
#>  3 00592  97634      -0.241 TRUE
#>  4 14415  64967       0.208 TRUE
#>  5 06238  97634      -0.215 TRUE
#>  6 06238  27971      -0.238 TRUE
#>  7 10231  97634       0.450 TRUE
#>  8 54596  27971       0.213 TRUE
#>  9 54596  63088      -0.246 TRUE
#> 10 96748  56741       0.211 TRUE
#> 11 13080  56741       0.257 TRUE
Item misspecifications
Diagnosing item-level problems
-
Item-level fit with posterior predictive model checks
- p-values
- Conditional probabilities
- Odds ratios
Item discrimination
Q-matrix validation
Item discrimination
-
Evaluates how well an item is able to distinguish between attribute profiles
- Item- and test-level discrimination (Henson & Douglas, 2005)
- Attribute-level discrimination (Henson et al., 2008)
Higher is better, but no clear thresholds as values are dependent on the number of attributes, model that was estimated, etc.
Low values may indicate an item is not measuring what we intend (or not measuring well)
CDI with measr
cdi(ecpe_lcdm)
#> $item_discrimination
#> # A tibble: 28 × 5
#>    item_id overall morphosyntactic cohesive lexical
#>    <chr>     <dbl>           <dbl>    <dbl>   <dbl>
#>  1 E1       0.0685          0.0639   0.0497  0
#>  2 E2       0.0491          0        0.102   0
#>  3 E3       0.0956          0.144    0       0.0400
#>  4 E4       0.141           0        0       0.293
#>  5 E5       0.0908          0        0       0.188
#>  6 E6       0.0750          0        0       0.155
#>  7 E7       0.247           0.383    0       0.0797
#>  8 E8       0.0633          0        0.131   0
#>  9 E9       0.0920          0        0       0.191
#> 10 E10      0.201           0.416    0       0
#> # ℹ 18 more rows
#>
#> $test_discrimination
#> # A tibble: 1 × 4
#>   overall morphosyntactic cohesive lexical
#>     <dbl>           <dbl>    <dbl>   <dbl>
#> 1    3.58            2.70    0.962    3.48
Exercise 3
Calculate the CDI for the PIE HDCM model
What conclusions or recommendations might we make based on these results?
cdi(pie_hdcm)
#> $item_discrimination
#> # A tibble: 15 × 5
#>    task  overall     L1     L2    L3
#>    <chr>   <dbl>  <dbl>  <dbl> <dbl>
#>  1 00592  0.124  0.737  0      0
#>  2 14415  0.108  0.545  0      0
#>  3 56400  0.0358 0.152  0      0
#>  4 64967  0.0162 0.0760 0      0
#>  5 06238  0.0974 0      0.175  0
#>  6 10231  0.0613 0      0.110  0
#>  7 54596  0.0224 0      0.0403 0
#>  8 96748  0.148  0      0.267  0
#>  9 97634  0.102  0      0.183  0
#> 10 13080  0.631  0      0      1.11
#> 11 27971  1.17   0      0      2.12
#> 12 56741  0.389  0      0      0.699
#> 13 63088  1.90   0      0      3.53
#> 14 81175  0.599  0      0      1.04
#> 15 88063  0.234  0      0      0.395
#>
#> $test_discrimination
#> # A tibble: 1 × 4
#>   overall    L1    L2    L3
#>     <dbl> <dbl> <dbl> <dbl>
#> 1    5.63  1.51 0.776  8.90
Q-matrix validation
-
The Q-matrix defines which items measure each attribute
- Is the Q-matrix correct?
- Are there other Q-matrices that might better explain the observed data
measr implements a general Q-matrix validation measure from de la Torre & Chiu (2016)
-
Assumes that the set of attributes is correct
- Does not evaluate whether additional, fewer, or different attributes would be appropriate
Q-matrix validation with measr
qmatrix_validation(ecpe_lcdm)
#> # A tibble: 28 × 5
#>    item_id original_specification original_pvaf empirical_specification
#>    <chr>   <chr>                          <dbl> <chr>
#>  1 E1      [1, 1, 0]                      0.995 <NA>
#>  2 E2      [0, 1, 0]                      0.989 <NA>
#>  3 E3      [1, 0, 1]                      0.996 <NA>
#>  4 E4      [0, 0, 1]                      0.980 <NA>
#>  5 E5      [0, 0, 1]                      0.993 <NA>
#>  6 E6      [0, 0, 1]                      0.980 <NA>
#>  7 E7      [1, 0, 1]                      1.000 <NA>
#>  8 E8      [0, 1, 0]                      0.986 <NA>
#>  9 E9      [0, 0, 1]                      0.925 [1, 0, 1]
#> 10 E10     [1, 0, 0]                      0.983 <NA>
#> # ℹ 18 more rows
#> # ℹ 1 more variable: empirical_pvaf <chr>
Exercise 4
Check the Q-matrix for the PIE HDCM
Are there any items that may measure additional pathway levels?
qmatrix_validation(pie_hdcm)
#> # A tibble: 15 × 5
#>    task  original_specification original_pvaf empirical_specification
#>    <chr> <chr>                          <dbl> <chr>
#>  1 00592 [1, 0, 0]                      0.450 [1, 0, 1]
#>  2 14415 [1, 0, 0]                      0.580 [1, 0, 1]
#>  3 56400 [1, 0, 0]                      0.699 [1, 0, 1]
#>  4 64967 [1, 0, 0]                      0.150 [0, 1, 1]
#>  5 06238 [0, 1, 0]                      0.522 [1, 1, 1]
#>  6 10231 [0, 1, 0]                      0.551 [0, 1, 1]
#>  7 54596 [0, 1, 0]                      0.470 [0, 1, 1]
#>  8 96748 [0, 1, 0]                      0.875 [1, 1, 1]
#>  9 97634 [0, 1, 0]                      0.461 [0, 1, 1]
#> 10 13080 [0, 0, 1]                      0.997 <NA>
#> 11 27971 [0, 0, 1]                      1.000 <NA>
#> 12 56741 [0, 0, 1]                      0.996 <NA>
#> 13 63088 [0, 0, 1]                      1.000 <NA>
#> 14 81175 [0, 0, 1]                      1.000 <NA>
#> 15 88063 [0, 0, 1]                      1.000 <NA>
#> # ℹ 1 more variable: empirical_pvaf <chr>
Model misspecifications
Attributes and items